Georgetown, Leander, New Braunfels and other Texas cities highlighted in US Census release
Published: Fri, 05/27/22
FOR IMMEDIATE RELEASE: THURSDAY, MAY 26, 2022
Fastest-Growing Cities Are Still in the West and South
RELEASE NUMBER CB22-90
Some Cities Experienced Slower Growth Since 2020
MAY 26, 2022 — Populations of cities and towns in the South and West regions of the United States still experienced the most growth from July 2020 to July 2021, with the top 15 fastest-growing cities or towns located in these regions, according to new population estimates for cities and towns, released by the U.S. Census Bureau today.
Eight of the 15 fastest-growing large cities or towns by percent change were in the West — with five in Arizona — and seven in the South. The South and West also contained the top 15 cities with the largest numeric gains — 11 in the South and four in the West.
“While only 4% of all cities and towns had a population of 50,000 or more in 2021, collectively they contained 129.3 million people — nearly 39% of the U.S. population,” said Crystal Delbé, a statistician in the Population Division at the Census Bureau. “On the other hand, of the 19,494 incorporated places in the United States, more than 75% had fewer than 5,000 people.”
Top Places for Population Growth
Arizona, Texas, Florida and Idaho all had several places among the 15 fastest-growing cities or towns:
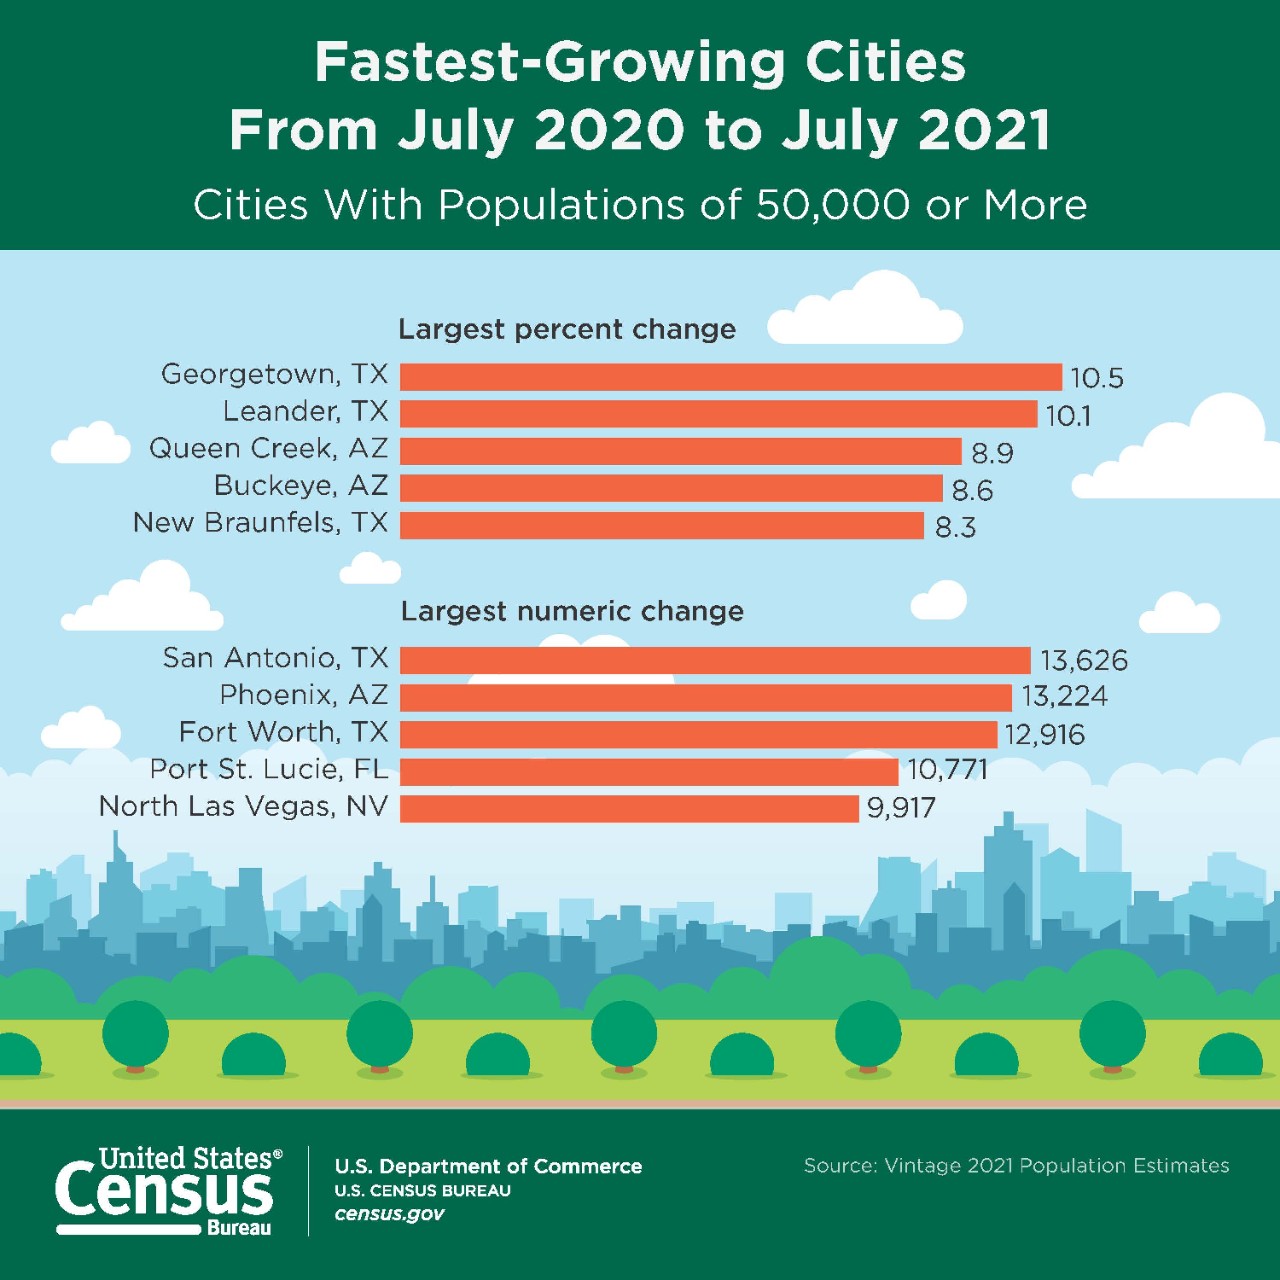
- Georgetown, Texas, had the largest growth from July 2020 to July 2021, increasing by 10.5%, a rate of growth which would double the population in less than seven years.
- Georgetown was followed by Leander, Texas (10.1%); Queen Creek Town, Arizona (8.9%); Buckeye, Arizona (8.6%); and New Braunfels, Texas (8.3%).
- The sixth-fastest-growing area was Fort Myers, Florida (6.8%), followed by Casa Grande, Arizona (6.2%); Maricopa, Arizona (6.1%); North Port, Florida (5.5%); Spring Hill, Tennessee (5.4%); Goodyear, Arizona (5.4%); and Port St. Lucie, Florida (5.2%).
- Rounding out the list were three suburbs of Boise, Idaho: Meridian (5.2%), Caldwell (5.2%) and Nampa (5.0%).
San Antonio, Texas, topped the list of the largest numeric gainers with an increase of 13,626 people between 2020 and 2021.
- Following San Antonio were Phoenix, Arizona (13,224); Fort Worth, Texas (12,916); Port St. Lucie, Florida (10,771); North Las Vegas, Nevada (9,917); Cape Coral, Florida (8,220); Buckeye, Arizona (8,001); Frisco, Texas (7,933); New Braunfels, Texas (7,538); Georgetown, Texas (7,193); Meridian, Idaho (6,234); Leander, Texas (6,159); Fort Meyers, Florida (5,891); Denton, Texas (5,844); and McKinney, Texas (5,568).
Most Populous Cities
The top 15 largest cities remained the same as in 2020 although more than half experienced decreases in their population between 2020 and 2021: New York, New York (-305,465); Los Angeles, California (-40,537); Chicago, Illinois (-45,175); Houston, Texas (-11,777); Philadelphia, Pennsylvania (-24,754); San Diego, California (-3,783); Dallas, Texas (-14,777); San Jose, California (-27,419); and Indianapolis, Indiana (-5,343).
- The other six most populous cities experienced some moderate to small growth in population. San Antonio, Texas, had the highest numeric gain of 13,626 people between 2020 and 2021. Followed by Phoenix, Arizona (13,224), and Fort Worth, Texas (12,916).
- The remaining three large cities experienced relatively small population growth. Those cities were Jacksonville, Florida (4,151); Austin, Texas (1,056); and Columbus Ohio (adding only 668 people).
Despite decreasing in population, New York remained the nation’s largest city. Its July 1, 2021, population of 8.5 million was more than twice that of the next largest city, Los Angeles, with a population of nearly 4 million.
- Following Los Angeles in population size were Chicago, Illinois (2.7 million); Houston, Texas (2.3 million); Phoenix, Arizona (1.6 million); Philadelphia, Pennsylvania (1.6 million); San Antonio, Texas (1.5 million); San Diego, California (1.4 million); Dallas, Texas (1.3 million); and San Jose, California (1.0 million).
Other Highlights
Population milestones:
- Seven places joined the list of cities with populations of 50,000 or more in 2021 with one addition located in the West, and the Midwest and the South each contributing three cities. The seven cities that passed the 50,000 population mark were Kyle, Texas (51,789); Burleson, Texas (51,618); Little Elm, Texas (51,042); Lincoln, California (50,649); Westfield, Indiana (50,630); Newark, Ohio (50,383); and Jeffersonville, Indiana (50,315).
- Six cities crossed the 100,000 population mark in 2021: Bend, Oregon (102,059); Goodyear, Arizona (101,733); Buckeye, Arizona (101,315); Fishers, Indiana (101,171); Carmel, Indiana (100,777); and Tuscaloosa, Alabama (100,618).
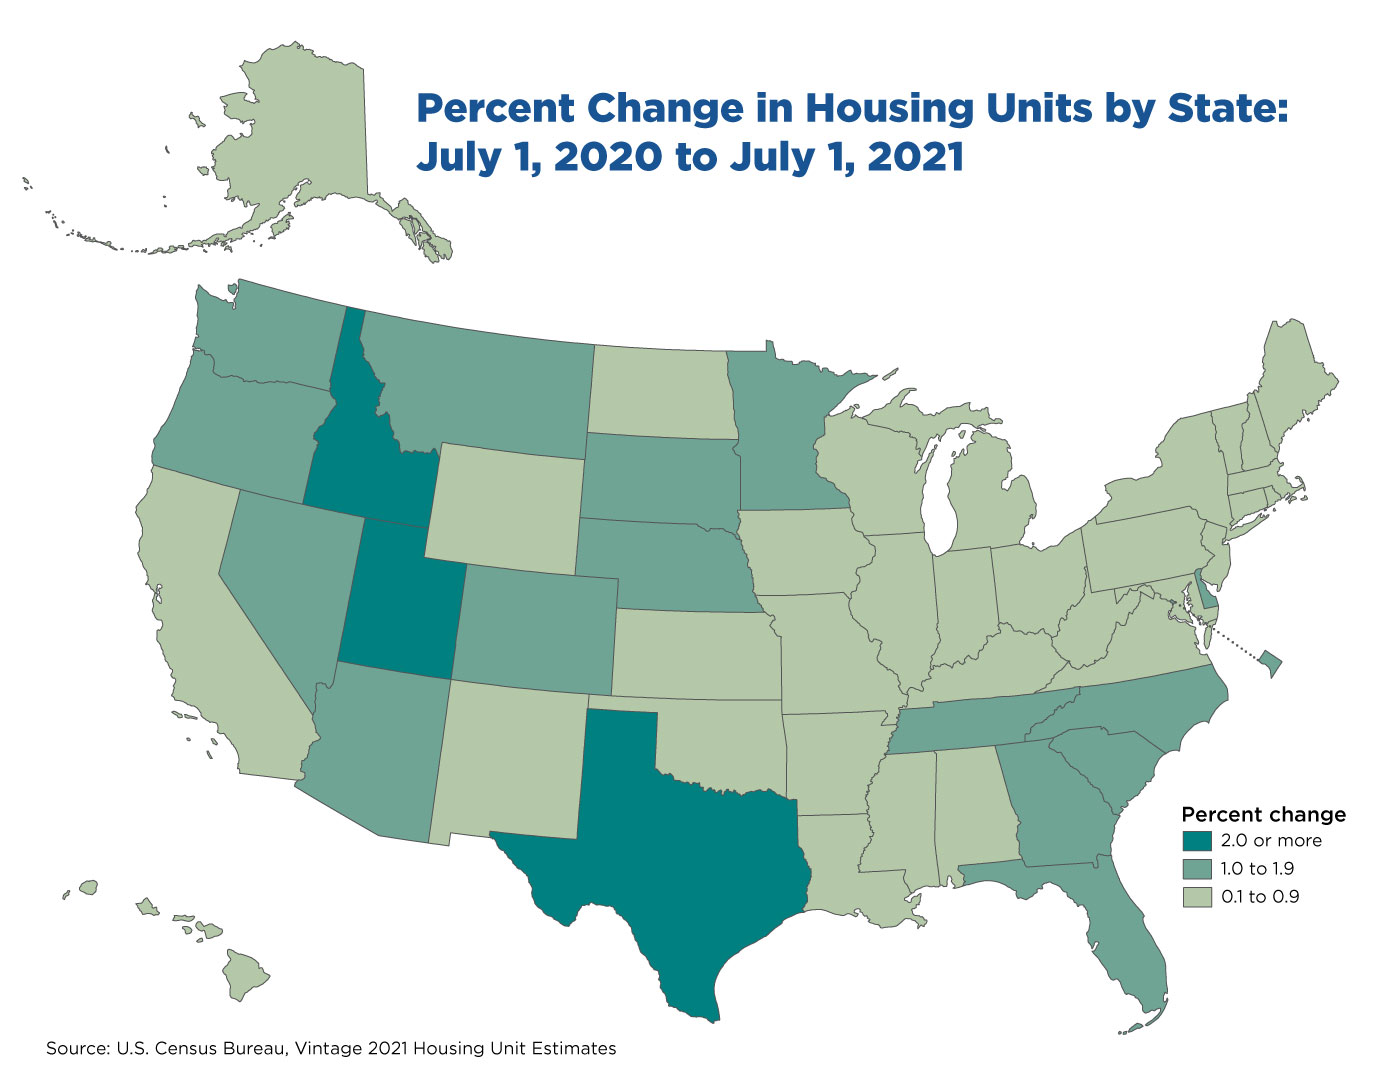
Modest Housing Unit Growth in Nearly All States
The nation’s housing stock grew by about 1.3 million units between July 2020 and July 2021, reaching a total of 142.2 million. The annual growth rate of 1.0% from 2020 to 2021 increased slightly from 0.8% in the 2019 to 2020 period.
- California had the largest number of housing units (14.5 million) on July 1, 2021, followed by Texas (11.9 million) and Florida (10.1 million). The states with the fewest housing units were Wyoming (274,400) and Alaska (327,900).
- Utah experienced the nation’s fastest growth in housing units, with an increase of 2.7 percent between July 1, 2020, and July 1, 2021, followed by Idaho (2.5%) and Texas (2.0%).
- The states with the slowest housing growth were Rhode Island (0.2%), Illinois (0.2%) and West Virginia (0.3%). The complete list is available at Percentage Change of Housing Units by State Map.
- The top five counties with the largest numeric gains in housing units between July 1, 2020, and July 1, 2021, were Harris County, Texas (34,132); Maricopa County, Arizona (29,935); Travis County, Texas (25,693); Los Angeles County, California (22,925); and Fort Bend County, Texas (14,230).
- The fastest-growing county was Rockwall County, Texas, which increased by 6.5% between July 1, 2020, and July 1, 2021, followed by Chambers County, Texas (5.7%); Jasper County, South Carolina (5.4%); Hays and Comal counties in Texas, and Morgan County, Georgia (5.2%) were tied for fourth fastest growing, followed by Fort Bend County (5.1%); and Long County, Georgia (5.0%).
| Table 1. The 15 Fastest-Growing Large Cities Between July 1, 2020, and July 1, 2021, With Populations of 50,000 or More on July 1, 2020 | ||||
| Rank | Area Name | State Name | Percent Increase | 2021 Total Population |
| 1 | Georgetown city | Texas | 10.5 | 75,420 |
| 2 | Leander city | Texas | 10.1 | 67,124 |
| 3 | Queen Creek town | Arizona | 8.9 | 66,346 |
| 4 | Buckeye city | Arizona | 8.6 | 101,315 |
| 5 | New Braunfels city | Texas | 8.3 | 98,857 |
| 6 | Fort Myers city | Florida | 6.8 | 92,245 |
| 7 | Casa Grande city | Arizona | 6.2 | 57,699 |
| 8 | Maricopa city | Arizona | 6.1 | 62,720 |
| 9 | North Port city | Florida | 5.5 | 80,021 |
| 10 | Spring Hill city | Tennessee | 5.4 | 53,339 |
| 11 | Goodyear city | Arizona | 5.4 | 101,733 |
| 12 | Port St. Lucie city | Florida | 5.2 | 217,523 |
| 13 | Meridian city | Idaho | 5.2 | 125,963 |
| 14 | Caldwell city | Idaho | 5.2 | 63,629 |
| 15 | Nampa city | Idaho | 5.0 | 106,186 |
| Table 2. The 15 Cities With the Largest Numeric Increase Between July 1, 2020, and July 1, 2021, With Populations of 50,000 or More on July 1, 2020 | ||||
| Rank | Area Name | State Name | Numeric Increase | 2021 Total Population |
| 1 | San Antonio city | Texas | 13,626 | 1,451,853 |
| 2 | Phoenix city | Arizona | 13,224 | 1,624,569 |
| 3 | Fort Worth city | Texas | 12,916 | 935,508 |
| 4 | Port St. Lucie city | Florida | 10,771 | 217,523 |
| 5 | North Las Vegas city | Nevada | 9,917 | 274,133 |
| 6 | Cape Coral city | Florida | 8,220 | 204,510 |
| 7 | Buckeye city | Arizona | 8,001 | 101,315 |
| 8 | Frisco city | Texas | 7,933 | 210,719 |
| 9 | New Braunfels city | Texas | 7,538 | 98,857 |
| 10 | Georgetown city | Texas | 7,193 | 75,420 |
| 11 | Meridian city | Idaho | 6,234 | 125,963 |
| 12 | Leander city | Texas | 6,159 | 67,124 |
| 13 | Fort Myers city | Florida | 5,891 | 92,245 |
| 14 | Denton city | Texas | 5,844 | 148,146 |
| 15 | McKinney city | Texas | 5,568 | 202,690 |
| Table 3. The 15 Most Populous Cities on July 1, 2021 | |||
| Rank | Area Name | State Name | 2019 Total Population |
| 1 | New York city | New York | 8,467,513 |
| 2 | Los Angeles city | California | 3,849,297 |
| 3 | Chicago city | Illinois | 2,696,555 |
| 4 | Houston city | Texas | 2,288,250 |
| 5 | Phoenix city | Arizona | 1,624,569 |
| 6 | Philadelphia city | Pennsylvania | 1,576,251 |
| 7 | San Antonio city | Texas | 1,451,853 |
| 8 | San Diego city | California | 1,381,611 |
| 9 | Dallas city | Texas | 1,288,457 |
| 10 | San Jose city | California | 983,489 |
| 11 | Austin city | Texas | 964,177 |
| 12 | Jacksonville city | Florida | 954,614 |
| 13 | Fort Worth city | Texas | 935,508 |
| 14 | Columbus city | Ohio | 906,528 |
| 15 | Indianapolis city (balance) | Indiana | 882,039 |
| Table 4. Total Population Living in Cities and Towns by Population Size as of July 1, 2021 | ||
| Population Size | Number of Cities | Total Population |
| Under 5,000 | 14,684 | 16,302,959 |
| 5,000 to 9,999 | 1,657 | 11,783,275 |
| 10,000 to 49,999 | 2,355 | 51,546,205 |
| 50,000 and Over | 798 | 129,277,621 |
The statistics released today cover all local functioning governmental units, including incorporated places (like cities and towns), minor civil divisions (such as townships), and consolidated cities (government units for which the functions of an incorporated place and its parent county have merged).
On June 30, 2022, the Census Bureau will release estimates of the July 1, 2021, population by age, sex, race, and Hispanic origin for the nation, states and counties, and population by age and sex for the Commonwealth of Puerto Rico and Puerto Rico municipios. The data will be embargoed (June 28, 2022).
With each new release of annual estimates, the entire time series of estimates is revised for all years back to the date of the last census. All previously published estimates (e.g., old vintages) are superseded and archived on the FTP2 site.
More information on the timing of specific population and housing unit estimates products is available at www.census.gov/programs-surveys/popest/about/schedule.html. The Census Bureau develops city and town population estimates by using updated housing unit estimates to distribute county household population to subcounty areas based on the average household population per housing unit. The Vintage 2021 methodology statement and release notes are available at www.census.gov/programs-surveys/popest/technical-documentation/methodology.html.